Why Choose Us

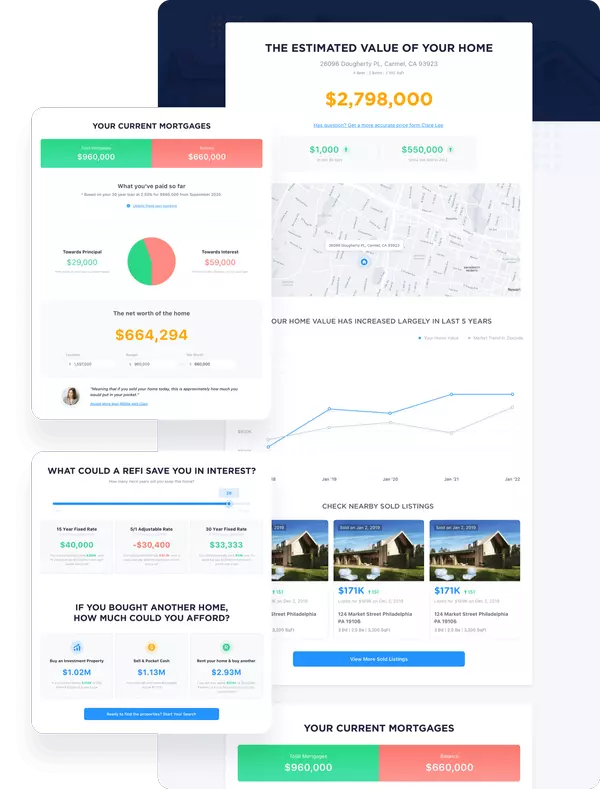
  • Free & Instant Home Valuation

    Estimate how much you can get by selling your home and keep track as the market changes.

  • Sell Faster

    Our team utilizes the power of online marketing to sell faster than an average real estate agent.

  • Save Money

    Our experts help you sell for the highest price point possible.

BLOGS

feature image of 2025 could be the last year of inventory shortage
2025 could be the last year of inventory shortage
Home prices in 2025 are a couple percentage points above where they were last year at this time. People often ask, “How can it be possible that home prices are still climbing even though the cost of money is so much higher?”There are obviously fewer buyers who can afford these prices.One reason that home prices have stayed elevated is that inventory nationally is still restricted.  On the supply-demand equation, demand is way down, but supply is still surprisingly low in much of the country, as well.If there are too few homes for sale, they don’t have to be affordable to everyone, they only have to be affordable to a few people. But if current trends continue, the inventory shortage will be effectively gone by next spring. Does that mean that home prices will fall? It might.In fact, while home prices are higher than a year ago, inventory has increased at the rate price appreciation has decreased. As more supply becomes available, these homes have to be affordable to more people. I’ve called this a compression in home prices. The 50-year average for annual home price appreciation in the U.S. is more like 5% per year. This year it’s 2%.When inventory finally builds back to the old, normal levels, that result could go to zero or even negative. Mortgage rates are a big variable here. In 2024, we saw a notable increase in buyer demand when mortgage rates got close to 6%. At that time in the fourth quarter, home sales picked up and home prices did too.Six percent is the threshold I’m watching again this year. If we spend any amount of the year at or near 6%, I expect that the inventory, sales and price trends will reverse. Let’s take a look at further late February data for the U.S. housing market.InventoryAvailable inventory of unsold single-family homes in the U.S. climbed this week almost half a percent to just over 640,000. There are 28.7% more homes on the market now than a year ago. This is the supply expansion I was talking about. However, mortgage rates were climbing to their highest level of the year at this time in 2024. Mortgage rates now are lower than they were a year ago.As rates climbed in 2023 in February, March, April, May all the way up to 7.5%, inventory grew each week pretty quickly. By the end of May there were 38% more homes on the market than the year prior. This year, rates are slowly easing down, so the expansion of inventory will be capped a bit.We’re expecting 18% inventory growth by the end of the year. Texas and Florida, which led inventory growth all last year, are now no longer the fastest growing states for unsold inventory. California and Arizona are. California and Arizona have 45% more homes unsold on the market now than a year ago. Texas only has 31% more homes on the market. This is a big shift from the trends of last year. This illustrates which areas are more mortgage rate-sensitive. Texas and Florida exploded in unsold homes when mortgage rates surged and are relatively less impacted now. California has had more of a steady growth in unsold homes. If Texas and Florida are more sensitive to rates, you can imagine what happens later this year if rates fall or rise substantially.In this chart we’re looking at 10 years of inventory across the country. At the far-right end you can see that inventory is starting to inch up for the spring.I’ve highlighted last year when there were only 500,000 single family homes on the market. I’ve also highlighted 2018 when there were 775,000 single family homes on the market that February. Assuming mortgage rates stay higher for this year, we’ll probably see that 2018 level again by next spring. In the inventory chart you can see three distinct phases. The left side of the chart is the last decade mortgage rates were falling for most of the decade. The more rates fall the more we want to own real estate. As we own more, the available inventory of unsold homes decreases. That’s the first phase.During the pandemic, that dynamic got supercharged. Rates dropped to ultra-low levels, so we wanted to own every bit of real estate possible. Inventory hit record lows as we bought everything in sight. Now we’ve had three years of rising interest rates and rising inventory. It looks like after four years of elevated mortgage rates, the market will finally be back to normal levels of unsold homes on the market. That’s next spring. As we approach that threshold of old levels of unsold homes on the market, it raises those questions about home prices. New listingsTo get a lot of homes on the market though we need some sellers. There were only 54,000 new listings of single-family homes unsold this week. That’s not a ton.There were another 10,000 new listings immediate sales which makes 64,000 homesellers. In total, it was another week with fewer home sellers that last year. It’s hard to grow inventory too much when there aren’t many sellers.Unsold new listings amount to 4.8% more than a year ago. Demand is slower so more of the sellers are sitting on the market. There are fewer immediate sales that go directly into contract. In this chart we’re showing those unsold new listings each week. It’s a little more than in 2024 or 2023. I continue to interpret any growth in sellers as a good sign for a healthier housing market. As always with the new listings data, we are vigilant for any signal of a lot of sellers or some kind of flood that would quickly change the supply-demand dynamics.The current thing to keep an eye on is whether a lot of federal government chaos leads to greater unemployment or financial distress for Americans. Does that lead to a change in the number of people who have to sell their house? There are early signs that unemployment in the Washington, D.C., metro is climbing for example. Are those people going to suddenly sell their homes? There’s a time lag between unemployment and inventory. Despite social media hysteria, the Washington, D.C., housing market is not showing signs of a flood of sellers, absolutely none.Here’s what a timeline could look like. Let’s say we see a massive spike in unemployment this spring in 2025. As people lose their jobs, they scramble, they get unemployment insurance, and they look for new work.However, they don’t typically rush to sell their house a week after they lost their job.If the economy has really tanked and you’ve been out of work for months, and future employment looks dubious, then you start to make financial arrangements. Once you’ve been out of work for about six months or more, this is when mortgage payments start being missed. That’s when you start working with the bank. After several months of that process, that’s when the distressed sales begin.When you add it all together it really implies that if major unemployment hits right now, this is 2026 inventory growth. And, while unemployment is on the rise, it’s still pretty low. Americans have jobs. The economy-employment-home sales cycle this time around has an added wrinkle which is homeowners all having ultra-low mortgage rates. So, selling their home would put them in worse cash flow position.In normal recession cycles, homeowners could swap a high mortgage payment for a lower rent payment and help correct the cash flow, but that’s mostly not true now. So, it could be that even if crazy policy changes trigger a big job loss recession, housing inventory gains could be much more limited than you’d expect.We are approaching the total inventory levels where home prices might have to adjust down. Is there any sign of a flood of sellers that will accelerate those inventory gains? As of right now there is not. But we always stay vigilant and measure every week. Home pricesMeanwhile, with greater supply of unsold homes, home prices are just barely positive compared to last year.Home prices are about 2% higher now than in February 2024. This week the median price of the new contracts came in at $385,000. That was down just a smidge from last week and is 2.6% greater than the same week a year ago. Home prices are compressing. Nationally, it is not accurate to say that home prices are falling. They’re higher than last year, but the growth rate is down. In 2024 home prices rose 4% over the year prior, now it’s only about 2%. There have been recent times when home prices fell. It happened in 2022 and you can see it in this chart here.At the left end of the chart is the purple line for 2025. We measured $385,000 as the median price for this week’s home sales contracts. Home prices generally climb for the spring season to peak in June before sliding down in the back half of the year. In 2022, that’s the green line here. There were notable moments when home prices dropped. Home prices adjusted down in June and again in September each time with big mortgage rate spikes. That is not happening now.Here in the spring of 2025, home prices are a little higher than a year ago, but barely. That’s why it looks like a further increase in inventory seems to be required before home prices turn negative nationally.As long as mortgage rates stay elevated, we should be on the watch for this pattern for home prices. If rates spike from here, due to something like inflation coming in high and the yield on the 10-year treasury jumping, then maybe mortgages hit 7.5% again.If that happens, I expect to see home prices adjust down like you can see in the 2022 line here. On the other hand, mortgage rates have been slowly inching lower for about a month. If we get lucky and rates continue to ease down closer to 6%, then the pattern will likely halt and home prices would likely have some resilience like they did last fall.You can see the impact on home prices in the blue line here for 2024. After the brief September dip in mortgage rates close to 6%, enough buyer demand was stimulated that home prices stayed elevated in the fourth quarter. 2024 had the opposite pattern from 2022 at the end of the year. Home salesHome prices inched down this week and home sales also dipped down for the week. We counted 57,000 new contracts pending for single family homes plus another 12,000 condo sales. That’s 6% fewer than last week and 5% fewer home sales than the same week a year ago. Home sales will generally continue to climb weekly for the spring. We should see a rebound to 60,000 or so in next week’s data. What we’re hoping for, though, has not been materializing.In this chart, we’d like to see the purple line for 2025 come in consistently above the blue line for 2024. Growth in home sales would be a good sign for the market and the economy.But since that hasn’t been happening, there are now 313,000 single-family homes in contract, which is fractionally fewer than a year ago. In the fourth quarter of 2024, home sales had built some growth, but that growth is gone now. As I mentioned earlier mortgage rates have been easing lower for a month and are below last year at this time. Rates are still near 7%, though. The bottom line on home sales is that there isn’t yet any sign of growth yet for 2025.Price reductionsMeanwhile, leading indicators for future sales prices also confirm this pattern I’ve been describing. The share of homes on the market with price reductions ticked up again his week by 20 basis points to 33.2%.There are more homes on the market now that have taken price cuts from the original list price than in any recent February. That’s a very clear statement about homebuyer demand versus the available supply in early 2025.I’ve been talking about this data point for several weeks now and the trend continues here into late February. In most years in February, you get fresh new supply and you get initial spring buyer demand. As a result, in many years in Q1 there are usually fewer price cuts each week. This year there are more price cuts each week. In the chart you can see the purple line for 2025. Price cuts are more common now than in previous years and increased for the week. The most obvious contrast is with the green line from 2023 where the market was finding surprising strength. In 2023, price cuts improved all the way to the end of April. This year, it was January when sellers started cutting prices more. Price cuts are measuring the homes on the market now, where sellers see weak demand. A price cut today hopefully generates an offer in March for a sale that closes in April. The price cuts data tells me we have weak home sales pricing for several more months at least. If mortgage rates do not cooperate and are still around 7% or higher by the end of the spring, that’s going to show up in this price cuts data. It’ll also show up in the inventory data and it’ll give us visibility on the possibility of home prices declining for the calendar year of 2025. Stay tuned. 
feature image of Mortgage rates fall as economic softness sends bond yields lower 
Mortgage rates fall as economic softness sends bond yields lower 
Mortgage rates decreased again today on weak economic data, following last Friday’s similar drop in the 10-year yield. Furthermore, the mortgage spreads in today’s pricing are favorable. According to the latest quote from Mortgage News Daily, mortgage rates are now around 6.89%. This represents a decline of 0.37% from the most recent high of 7.26%, which was recorded on Jan. 13. Many might be taken aback by this drop, especially given ongoing tariff talks, rising inflation expectations in surveys, and the Federal Reserve adopting a more hawkish stance — all hinting that mortgage rates could be inching toward 8%. Yet, as we’ve pointed out before, the recent improvement in mortgage spreads has remarkably kept rates from soaring too high, effectively putting a ceiling at around 7.25%. It’s an interesting twist in the market dynamics! Today, the ISM service sector data experienced a significant decline, dropping into negative territory for growth. The Michigan Confidence Index also decreased, along with existing home sales. Additionally, this week has witnessed job losses due to federal government layoffs, which means less money circulating in the economy. I discussed this on today’s episode of the HousingWire Daily podcast, posing the question: Is this what the White House truly wants when they discuss lowering the 10-year yield? Looking ahead to my 2025 forecast, I initially projected that the 10-year yield would peak at 4.70% while mortgage rates would peak at 7.25%. Earlier this year, we briefly eclipsed that 4.70% mark, and as I write this, we’re hovering around 4.43% on the 10-year yield. For the yield to climb above that 4.70% threshold or for mortgage rates to exceed 7.25%, the economy would need to outperform expectations. If economic data starts coming in weaker than anticipated — like when retail sales fell short last week — it wouldn’t be surprising to see bond yields dip as weaker economic data tends to lower bond yields. Primarily working from elevated levels in my forecast, it’s a low bar for yields to head lower than, let’s say the 10-year yield at 3.80%. Despite this, we’re still hanging on at the upper end of the mortgage rate forecast, and it’s worth noting that the housing market has shown signs of improvement only when mortgage rates approach the 6% mark. I know it’s been a whirlwind of headlines lately that have left many questioning the future of the economy and the housing market. That’s why we’ve put together our weekend Housing Market Tracker — to ensure everyone stays in the loop with the latest housing data. I prioritize tracking the overall economic cycle first, and I’m committed to keeping you informed, especially during these unpredictable times. Keeping it simple, today economic data came in weaker, stocks are falling, money went into bonds and mortgage rates fell.  👉 Search homes for sale
feature image of Home Sales Drop 4.9% in January in Disappointing Start to the New Year
Home Sales Drop 4.9% in January in Disappointing Start to the New Year
Mark Humphrey/Association PressSales of previously owned homes slowed down in January amid higher mortgage rates, setting a disappointing tone for the start of the new year.Existing-home sales dropped 4.9% last month from December, to a seasonally adjusted annual rate of 4.08 million, the National Association of Realtors® reported Friday. However, the January sales figure was up 2% from the same month a year earlier.Home prices continued to rise on an annual basis, with the median sales price for all existing housing types at $396,900 in January, up 4.8% from one year ago.This sales price figure is somewhat different from median home listing prices, which have recently declined on an annual basis, says Realtor.com® Chief Economist Danielle Hale.“Recent sales growth has been more robust among higher price points, whereas data show that among listings lower-priced tiers have seen stronger gains, driving some of the divergence in the two price measures,” she says.Mortgage rates have hovered in a tight range close to 7% so far this year, averaging 6.96% in January compared with 6.72% in December, according to Freddie Mac.“Mortgage rates have refused to budge for several months despite multiple rounds of short-term interest rate cuts by the Federal Reserve,” says NAR Chief Economist Lawrence Yun. “When combined with elevated home prices, housing affordability remains a major challenge.”Sales of previously owned homes account for the vast majority of all home sales. Existing-home sales are recorded when the transaction is completed and include single-family homes, condos, co-ops, and townhouses.Supply of homes for sale rises as spring approachesThe supply of previously owned homes for sale rose last month, sending a potentially friendly signal to buyers as the spring selling season approaches.Total housing inventory for sale was 1.18 million units at the end of January, up 3.5% from December and 16.8% higher than one year ago. Unsold inventory sits at a 3.5-month supply at the current sales pace, up from 3.2 months in December and 3.0 months a year earlier.“More housing supply allows strongly qualified buyers to enter the market,” Yun says. “But for many consumers, both increased inventory and lower mortgage rates are necessary for them to purchase a different home or become first-time homeowners.”Sales remain flat in Midwest, fall elsewhereIn January, existing home sales were unchanged from December at an annual rate of 1 million, up 5.3% from the previous year. The median home price in the Midwest was $290,400, up 7.2% from January 2024.Sales fell in the other regions on a monthly basis, led by the West, where they slumped 7.4% in January to an annual rate of 750,000, up 1.4% from a year ago. The median price in the West was $614,200, up 7.4% from January 2024.In the South, sales fell 6.2% from December to an annual rate of 1.83 million in January, identical to one year earlier. The median price in the South was $356,300, up 3.5% from last year.In the Northeast, existing-home sales dropped 5.7% from December to 500,000 annualized, up 4.2% from January 2024. The median price in the Northeast was $475,400, up 9.5% from one year earlier.